
Annuity Rates & Trends (Updated Monthly)
The trends in annuity interest rates tend to mirror the trends in bond interest rates. That's because insurance companies typically invest as much as 70% of their capital in fixed income securities, notably, corporate bonds. (Contrary to popular belief, insurance companies in the aggregate invest less than 15% of their overall assets in stocks.)
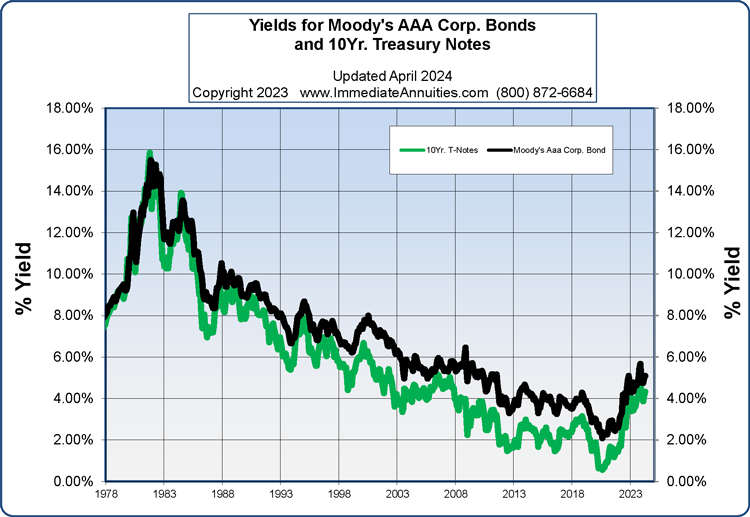
To get a handle on the trends in annuity interest rates we track Moody's AAA Corporate Bond Index. This index is a conservative proxy for estimating the interest rates that insurance companies earn in their portfolios. Moody's index includes bonds with remaining maturities as close as possible to 30 years. It drops a bond when the remaining life falls below 20 years, if the bond is susceptible to redemption, or if the rating changes.
In the first chart, we compare the Moody's index with rates from the US Treasury's 10-Year Note. Since the average duration of Moody's index (black line) is 20-30 years, its yield tends to be significantly higher than the yield on the 10 year T-Note (green line).
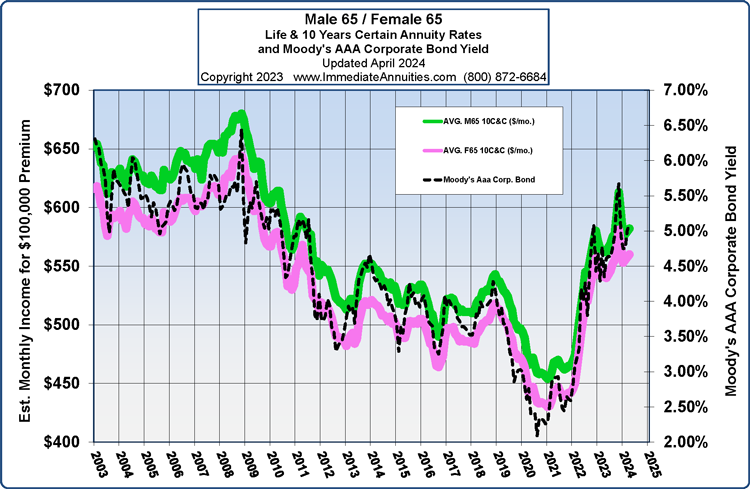
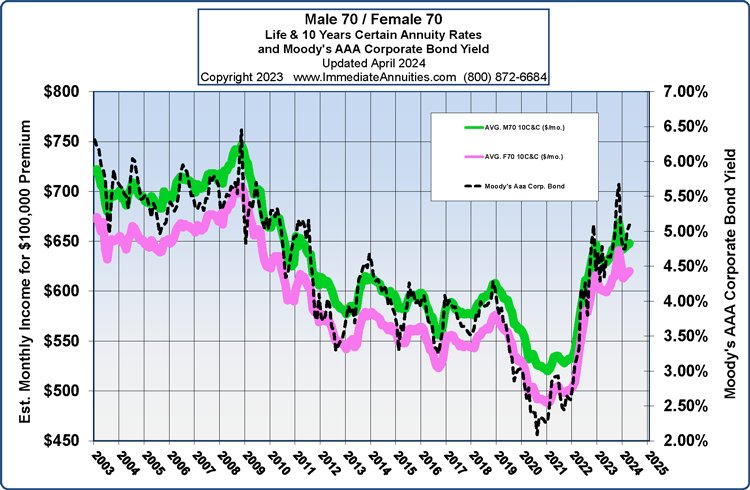
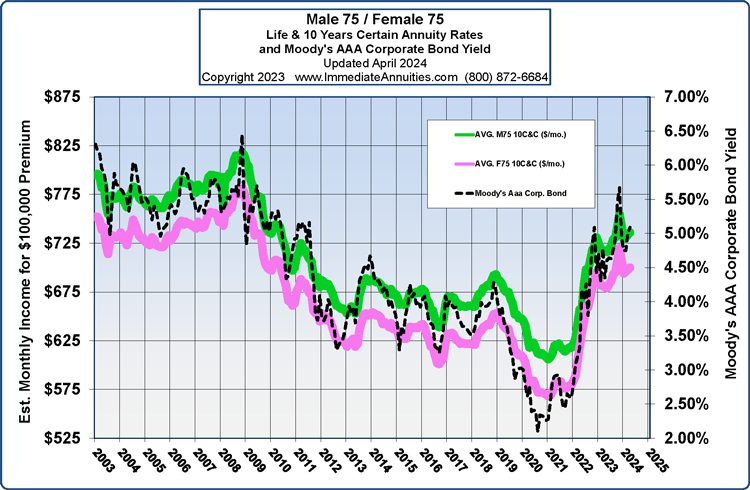
In the following charts, we compare the monthly income received from an immediate annuity (at different ages, for men and women) with the Moody's index. There is a strong correlation between the annuity payout graphs (green and pink lines) and the interest rate index (dotted lines).
Click to view source of this data and historical charts
If you'd like to get a free, personalized annuity quote without any sales agents calling you, click this link to our Instant Annuity Calculator page.


We'd love to hear from you!
Please post your comment or question. It's completely safe – we never publish your email address.
Comments (8)
Patricia
2016-02-09 14:42:13
As the percent of retirees in the population continues to increase it seems likely that more of us will be purchasing an annuity. How do you think having more people buying annuities will affect payout rates?
Hersh Stern (ImmediateAnnuities.com)
2016-02-09 14:43:39
Hi Patricia-
First, let's put the purchase volume of immediate annuities in perspective. In each of the past 10 years there's been over $200B of new annuity premium paid in the US. Of this total only about $10B was towards the purchase of an immediate annuity. So we're speaking about a tiny slice of the total annuity "pie."
Next, the pricing of immediate annuities is determined largely by three factors: the interest rates insurance companies earn on their assets, mortality or life expectancy statistics, and insurance company operating costs and profit margins.
About 70% of insurance industry assets are invested in corporate bonds. So you'd expect a very high correlation between fluctuations in Moody's Corporate Bond Index and immediate annuity payout rates. You can see that's the case from the charts on this page.
Life expectancy has been increasing gradually so that will create a slight dampening effect on payout rates in the coming years. However, I believe the direction of interest rates has a much greater impact.
To sum up, I think the overall number of retirees has very little to do with the pricing of annuities. Changes in bond interest rates, predominantly, and medical advances in longevity, to a lesser extent, are the main determinants to consider.
Hersh
William
2019-03-29 09:15:54
If corporate bond are yielding 4%, what would be the yield on 3 or 5 year deferred annuities for a 77 year old?
Hersh Stern (ImmediateAnnuities.com)
2019-03-29 09:36:49
Hi William,
Here is a list of our current deferred annuity rates:
https://www.immediateannuities.com/deferred-annuities
You'll see that currently you can find some rates in the 4% range for a 5 year. These are subject to change frequently and without notice.
-Hersh
Houda
2019-09-13 11:14:34
Interested in influence of interest rates on annuities payout and influence of the "for life" insurance component on payout.
Also, whether there are deferred fixed annuities, that is paid upfront, accumulate interest for a few years without taxation, then is paid out in fixed amounts?
Hersh Stern (ImmediateAnnuities.com)
2019-09-13 11:15:22
Annuity payouts strongly correlate to changes in the 10 & 30-Year Treasury Bond yields. However, the insurance companies lag slightly behind because they only change their rates once or twice a month.
There is an annuity called a Deferred Income Annuity (DIA) which operates as you describe. It is an annuitized policy that you purchase now, and schedule income payments to begin a certain number of years down the road. You will not be taxed until you start receiving income payments. You can run quotes for yourself by using the calculator on our homepage: https://www.immediateannuities.com/
-Hersh
Tom M.
2023-06-12 09:03:50
Of course I want the annuity that has the highest payout. The ones that guaranteed monthly income for life. With a refund guarantee to my beneficiaries. It can start now or wait a year like some of the best ones if you wait a year it is much better.
Dan P.
2023-10-16 07:01:42
MANY thanks for this extremely helpful explanation with outstanding graphs.
You folks are the best!
Dan